Predicting The 2026 NBA Champion with Machine Learning
Every NBA season begins with the same question: What actually separates championship teams from everyone else?
Is it superstar talent? Veteran experience? Elite offense? Defensive dominance? Or are championship teams simply built differently from the rest of the league in ways the eye test cannot fully explain?
For years, NBA conversations have revolved around narratives: superteams, playoff experience, star power, chemistry, coaching, and roster depth. But beyond the headlines and debates, the data may tell a clearer story.
To explore that question, machine learning models were trained on over two decades of NBA team statistics to identify which factors were most consistently associated with championship success and if those patterns could help predict future NBA champions.
The Challenge of Predicting an NBA Champion
Predicting NBA champions is an unusually difficult machine learning problem.
Across 23 NBA seasons, there are hundreds of teams (but only 23 champions). This creates a highly imbalanced dataset where the overwhelming majority of observations belong to the “non-champion” class.
In problems like this, accuracy alone can become misleading. A model could theoretically predict that no team wins the championship every year and still achieve extremely high accuracy simply because champions are so rare.
Because of this, the project focused less on raw accuracy and more on how effectively each model identified actual championship teams without producing excessive false positives.
Building the Dataset
The dataset used in this analysis contained historical NBA team statistics from the 2000–2023 seasons.
To avoid data leakage, variables directly tied to final outcomes such as wins, losses, rankings, and win percentage were removed before training the models. Instead, the analysis focused on broader performance indicators that could realistically help evaluate contender-level teams before a championship outcome is known.
The final model included:
Net Rating (NRtg)
Simple Rating System (SRS)
True Shooting Percentage (TS%)
Strength of Schedule (SOS)
Average Team Age
These variables were selected after exploratory analysis and correlation testing revealed moderate relationships with championship success.
Rather than relying on a single metric, the project aimed to identify the traits most consistently associated with championship teams, including efficiency, overall performance, and veteran experience across multiple categories.
Which Metrics Actually Matter?
One of the clearest trends throughout the analysis was the importance of efficiency.
Teams with stronger Net Ratings and higher True Shooting Percentages consistently appeared among contenders, while weaker teams clustered toward the bottom of both categories.
Net Rating proved especially valuable because it captures a team’s overall point differential efficiency across both offense and defense. Instead of measuring one isolated aspect of performance, it reflects how dominant a team is over the course of an entire regular season.
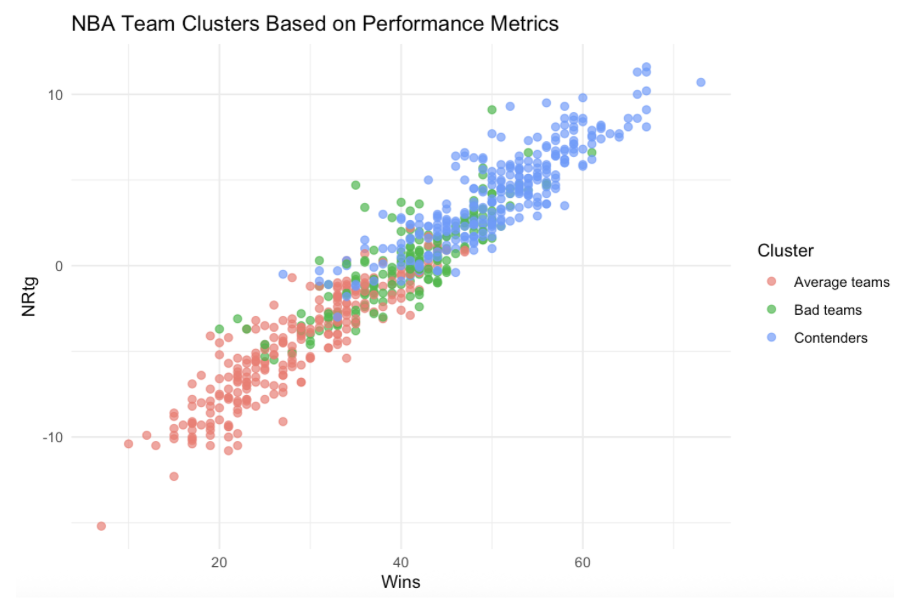
Net Rating Vs. Wins
True Shooting Percentage also emerged as one of the strongest indicators of contender-level performance. Teams that score efficiently (particularly through three-point shooting and free throws) outperformed less efficient offenses.
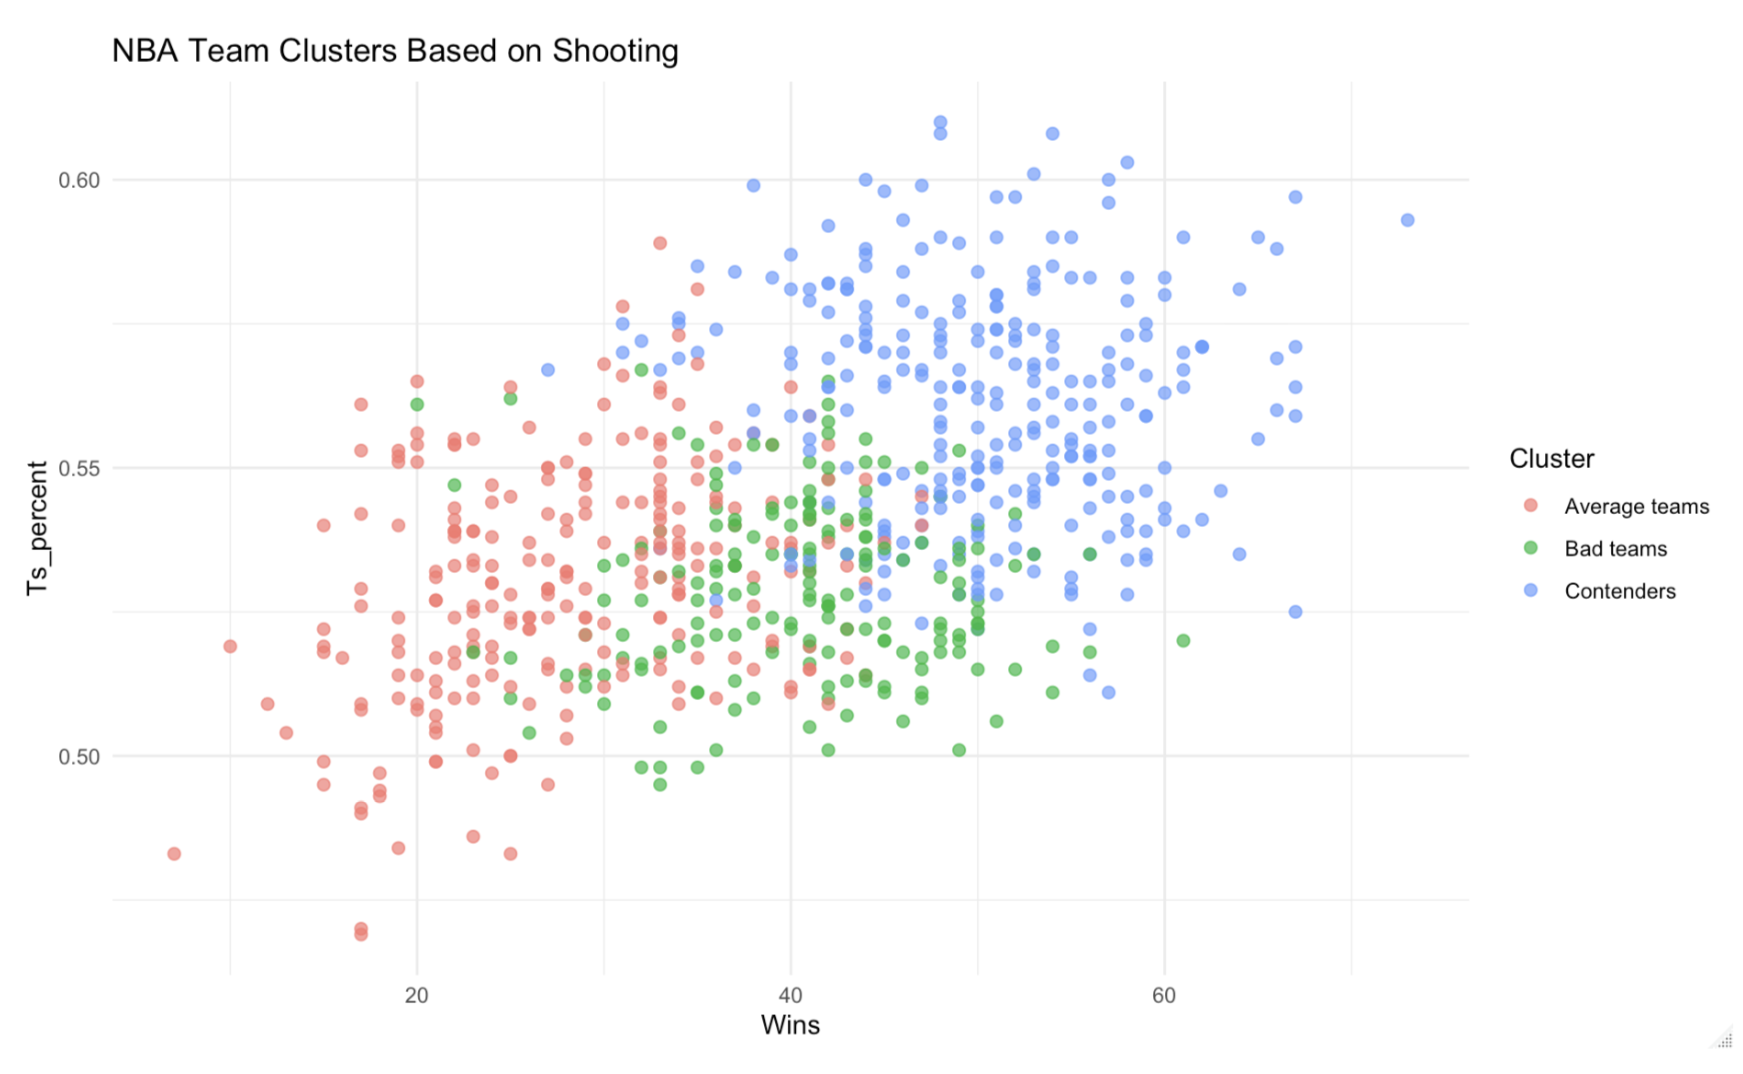
True Shooting Percentage vs. Wins
Another interesting trend appeared when examining a team’s average age.
Older teams tended to win more games and were more frequently grouped among championship contenders. While age alone does not determine success, the data suggested that experience and roster maturity may play a meaningful role during playoff-level competition.
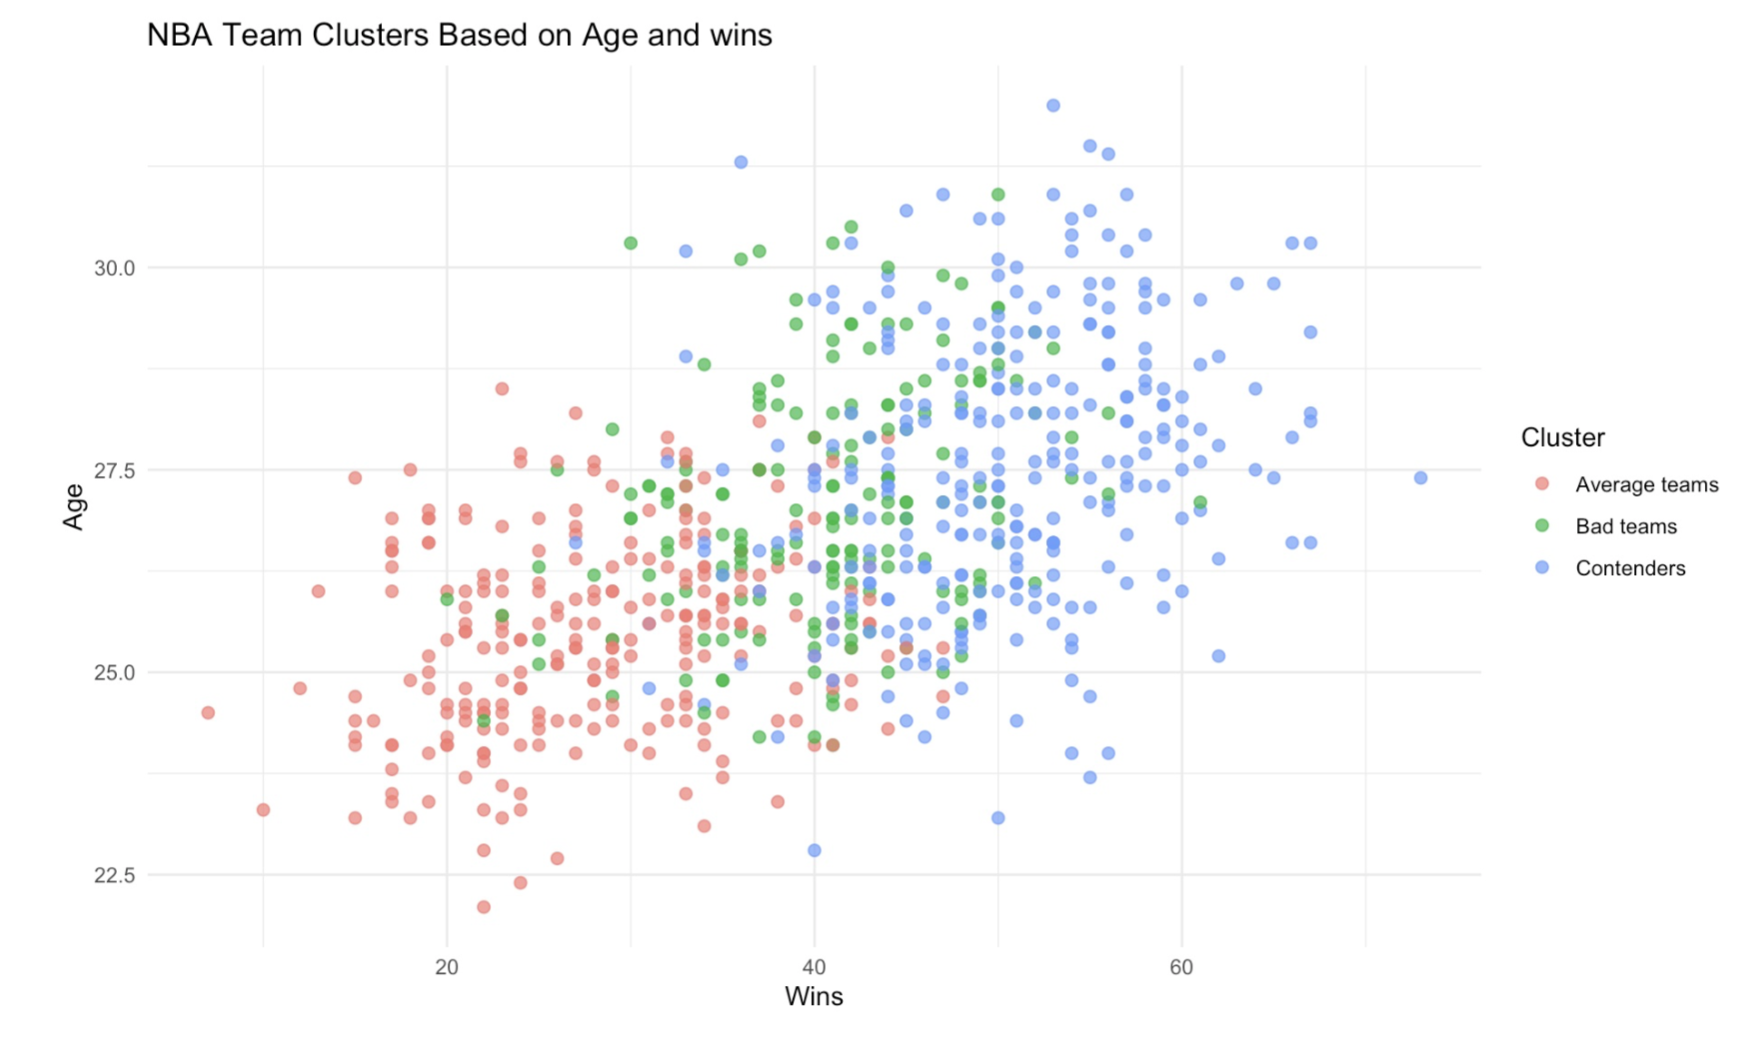
Average Age vs. Wins
Training the Models
To evaluate predictive performance, the dataset was split into:
70% training data
30% testing data
Two classification models were then trained:
Logistic Regression
Random Forest
The logistic regression model served as a baseline model because of its interpretability and simplicity, while the random forest model was introduced to capture potentially more complex and nonlinear relationships within the data.
A probability threshold of 0.10 was used instead of the standard 0.50 threshold due to the rarity of championship teams within the dataset. Lowering the threshold helped reduce the risk of missing actual champions.
The Simple Model Wins
One of the most interesting findings from this project was that logistic regression outperformed the more complex random forest model in identifying championship teams.
The logistic regression model correctly identified 7 of the 8 championship teams in the testing dataset, while the random forest model correctly identified only 3 of the 8 champions.
Although both models achieved similarly high overall accuracy scores, the confusion matrices revealed a major difference in performance.
The random forest model was significantly more conservative, producing fewer false positives but missing far more actual champions. Logistic regression, despite generating more false positives, proved far more effective at identifying legitimate title-winning teams.
This result highlights an important concept in machine learning:
More complex models do not automatically produce better outcomes.
In this case, many of the relationships between the selected variables and championship success appeared to be relatively linear, allowing the simpler logistic regression model to generalize more effectively than the random forest model.
Predicting the Next NBA Champion
After evaluating historical performance, the logistic regression model was applied to current NBA teams in order to estimate championship probabilities for the season.
The model ranked the following teams as the most probable championship contenders:
Oklahoma City Thunder — 18.8%
New York Knicks — 13.9%
Boston Celtics — 13.3%
At the time of the analysis, the Thunder and Knicks were still active playoff teams, while external betting markets and media projections also viewed Oklahoma City as one of the strongest title contenders.
Rather than producing a simple “champion vs non-champion” prediction, the model generated probability-based rankings that provided a more realistic way to evaluate team strength across the league.
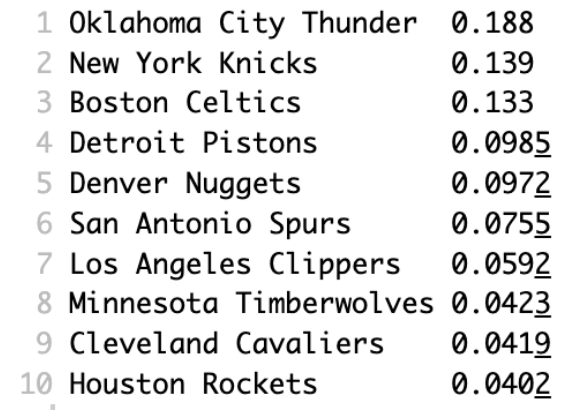
Top 10 Teams Most Probable to Win the 2026 NBA Championship
Key Takeaways
Several consistent trends emerged throughout the analysis:
Teams with stronger Net Ratings were significantly more likely to contend for championships.
Shooting efficiency, particularly True Shooting Percentage, played a major role in contender-level success.
More experienced teams tended to perform better overall.
Logistic regression outperformed random forest despite being the simpler model.
Machine learning models were more effective at identifying contenders than predicting exact champions.
The findings also reinforced an important reality about sports analytics:
Even strong predictive models cannot fully account for the unpredictability of playoff basketball.
Factors such as injuries, roster changes, playoff matchups, and individual player performances remain difficult to quantify using regular season team statistics alone.
Still, the analysis demonstrated that machine learning can be effective, and identify many of the statistical patterns that consistently appear among championship-level NBA teams.
Final Thoughts
This project was designed not only to explore NBA championship prediction, but also to demonstrate how machine learning workflows can be applied to real-world classification problems involving:
feature selection
class imbalance
model evaluation
probability-based prediction
performance interpretation
While sports analytics provided the context for this project, the broader objective was understanding how predictive models behave in situations where outcomes are rare, noisy, and highly competitive.
And in the case of predicting NBA champions, even the best models still have to compete with the unpredictability of the playoffs.
Citations
“NBA Futures – 2025–26 NBA Finals Champion Odds.” ESPN. ESPN Internet Ventures,
https://www.espn.com/nba/futures
Kuhn, Max. “createDataPartition.” caret: Classification and Regression Training, CRAN,
https://cran.r-project.org/web/packages/caret/refman/caret.html#createDataPartition.
Wickham, Hadley, et al. “across.” dplyr: A Grammar of Data Manipulation, CRAN,
https://cran.r-project.org/web/packages/dplyr/refman/dplyr.html#across
Data Source:
https://www.kaggle.com/datasets/bluedreamv1b3/nba-teams-stat-2000-2023/code