Are NBA Players Overpaid?
Introduction
In the past couple of years, a lot of young NBA players have received high-value contracts after their rookie deals expire. While some of these players show strong early-career performance and promise for years to come, the question worth investing time into is whether their salaries align with their production. This project proposes to do a statistical analysis to see if some players are being overpaid or underpaid compared to their performance metrics.
The hypothesis for this project is that there are NBA players whose production does not equate to their high salaries, as well as the opposite as other NBA players who have high production that are undervalued. This may be due to market pressures, team needs, or other external factors not related to on the court influencing contract negotiations. The goal in this project is to find clusters of players based on performance metrics and then compare these clusters to salary data to find the outliers.
All of the datasets that were used in this project were imported directly into R from csv files that were pulled from the website Stathead. This website is one of the leaders in the NBA statistical world and has virtually any stat you can think of for the NBA, they have a broad range of stats that range from advanced stats to salary contracts. Salaries for the NBA and regular and advanced statistic were pulled from this website to be used in this project.
Methods/Data Prep
Once the datasets were imported to R, the datasets were trimmed down to just the 2017-2021 draft classes that are still active in the NBA today(min 35 games). This project is targeting players on their rookie deals and players who just got paid to see if they qualify for their big contract based on the statistical measurements created. There was a lot of clutter in the datasets with duplicate names, N/A values, and non-numeric values in the dataset. Midway through the project, the initial observations that were seen in the dataset were that it was too small, only having fewer than 60 players. This would show that the statistical methods being conducted on this dataset required a larger dataset. To combat this, the dataset was opened up to two more draft classes, making the dataset range from 2016-2022. This made the final count of players in the dataset around 80 players, which was more players than the previous dataset, and made the statistical methods conducted much easier to do with a bigger dataset. This took time to clean and adjust, but after the dataset was cleaned, it was finally time to conduct statistical methods to see what this dataset had in store for the original question and hypothesis.
The methods used to conduct this project were k-means clustering in R and creating new statistical measurements called “Production Score” and “Should be paid.” The “Production Score” as it is called in the new dataset, was set to be an all in one measurement to show the raw production of an NBA player, the first variation of this production score was to take the z scores of different advanced statistics that were researched on the internet and add them all together to get a total z score that would be called “Production Score.”
The advanced statistics used in this were PER, TS%, WS48, and BPM. This was a good start and showed promise, but it showed that some players were getting valued too high or too low because of their PER. This called for more research on how to perfect this new statistic, and what came up was a website article written by Luis Depradine titled “Maximizing Value: Analyzing NBA Salary Efficiency.” In this article, it talked about capturing raw production in the NBA and rolling it up into one statistic to measure salary, sort of how this project was doing it. In Depradine’s own Production score, he added weight to each of his statistics he was adding up, 40% PER + 30% WS/48 + 30% VORP. After analyzing his results and seeing what Depradine did, the projects Production score changed to its final form being: 30% PER + 25% WS/48 + 25% VORP + 20% BPM, this adjustment showed to be successful making “Average” players closer to the mean and the “Superstar” players further away from their peers. Once this was created, the K-means cluster method was used to group players based on salaries into 4 tiers, and then, by this, grouping these players made it easier to see where everyone's production was on a dot plot. A new method was created to show if they exceed expectations or don’t meet expectations based on their production score ranking around their peers in each cluster, based on their contract. This proved to be very useful, but didn’t show the complete picture of what this project was trying to capture, so another statistical method was created to show how much a player in this dataset should be paid based on their production. To create this statistical method, it took more time and had to broaden the dataset to the whole NBA to get a more accurate number of what a player should be made, so the production scores of every NBA player was calculated and then shifted so that way there was no negative scores making negative salary projections. The salaries were added to this new dataset also. This “Should be Paid” stat was created by creating a fixed multiplier that takes the total salary of the NBA and then dividing this by the total shifted production score of the NBA. I then merged this column and filtered out the rest of the NBA to just see the results of the should be paid in the 2016-2022 dataset.
Results
This was very eye-opening, showing that players like Trae Young, Jaylen Brown, Pascal Siakam, and so many other “Superstar” players were not meeting expectations based on the production of other players that are in their same contract grouping. On the flip side, this also showed younger players who were still on their rookie contract, showing how undervalued they are and deserving of their big contract, like Mark Williams, Alpren Şengün, Walker Kessler, and many more. This also showed how good Shai Gilgeous-Alexander of the OKC Thunder was this year having one of the best seasons of all time on one of the best teams of all time, his production score was a 3.86, which was not only more than double anyone else in the 2016-2022 dataset but also the second best production score in the NBA to Nikola Jokic of the Denver Nuggets who is also having one of the greatest seasons of all time this year.
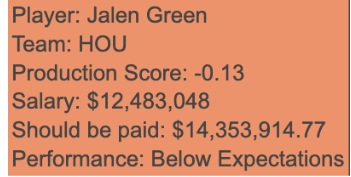
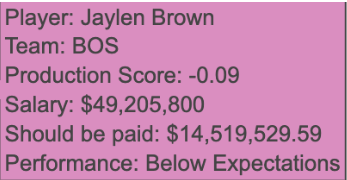
The results of this project were also eye-opening because the “Should be Paid” stat showed that almost every player who got paid after their rookie contract is overpaid. Let’s look at a player like Jaylen Brown of the Boston Celtics, who is the highest-paid player in the NBA currently this season, making $49.2 million. Granted, Jaylen Brown is the best second option in the league on one of, if not the best, team in the NBA. He is making too much money and doesn’t even exceed expectations based on his production score relative to his cluster, based on salary, this is a prime example of what this project was trying to show, that NBA players are making to much money based on their production, alone, which is flawed because a contract decision is made up of multiple factors that aren’t even on the court related. Now with being said, and just playing into hypotheticals based on this project, Jaylen Brown should be making around $14.5 million based on his production, which is around what Jalen Green makes, and who also has a similar production score to Jaylen Brown, which is a little negative.
Conclusion
In conclusion, this project’s question was answered, and the hypothesis was shown to be true just based on the examples that I have given in the report. Some players in the NBA are overpaid based on their overall production alone. But this doesn’t explain the whole story for why players might be paid the way that they are. This project should be used as a tool for NBA GMs to find the players that are extremely undervalued and will be salary cap friendly, and also identify the players that are not salary cap friendly based on their production-to-salary ratio to build a championship-winning team. But this should not be the only tool being used to determine why a player should get paid or not, because statistics will never be able to measure things like personality, leadership, and other mental intangibles that also should be taken into consideration for players getting their payday.
Works Cited
Depradine, Luis. “Maximizing Value: Analyzing NBA Salary Efficiency.” Medium, 27 Dec. 2024,luisdepradine.medium.com/maximizing-value-analyzing-nba-salary-efficiency-3232c5c225bb.
Basketball-Reference.com. Basketball Reference, Sports Reference LLC, 2025, www.basketball-reference.com.